External Thunder Observability Agent (TOA)
The external Thunder Observability Agent (TOA) is a lightweight autonomous data processing engine that can be externally installed and configured for any Thunder device.
The TOA offers the following capabilities for Thunder® Application Delivery Controller (ADC):
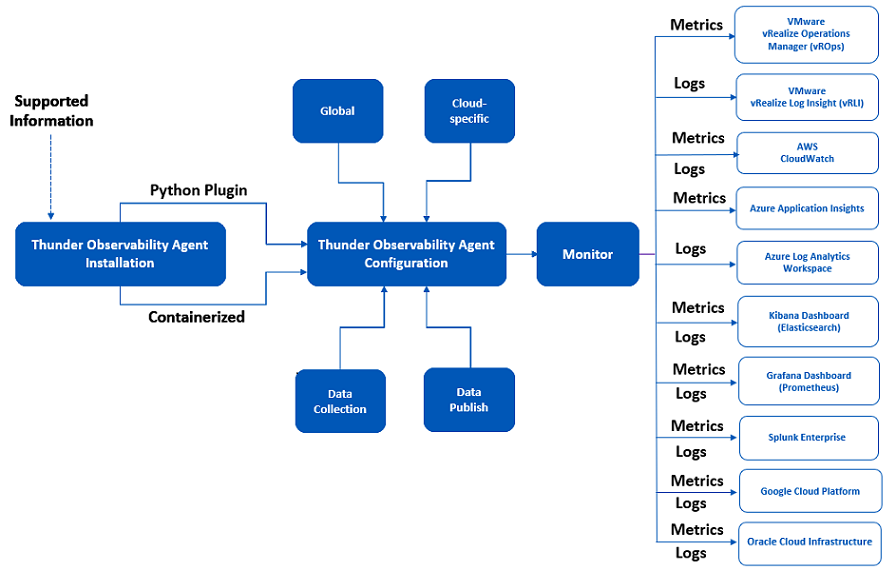
- Collects, processes, and publishes 14 Thunder metrics. The default data collection frequency is 1 minute. Thunder metrics can be sent to the platform where Thunder is deployed, which includes AWS, Azure, and VMware or can be sent to shared platforms like Elasticsearch (Kibana), Prometheus (Grafana), Splunk, Google Cloud Platform (GCP), and Oracle Cloud Infrastructure (OCI). Metrics can be sent to any one platform at a time. For more information on Thunder metrics, see Supported Thunder Metrics.
- Collects, processes, and publishes Thunder Syslogs. The default data collection frequency is 1 minute. The logs can be published on various platforms like AWS, Azure, VMware, Kibana (Elasticsearch), Grafana (Prometheus and Pushgateway), Splunk, GCP, and OCI. Logs can be sent to any one platform at a time. For more information on Thunder logs, see Supported Thunder Logs.
- Manages the data collection, processing, aggregation, and publishing internally.
- Provides multitasking capabilities to collect and process data from multiple Thunder instances and their partitions simultaneously. By default, it collects data from a shared partition.
- TOA supports Shared and L3V partitions. The maximum number of partitions supported per Thunder is 20.
- Installs on any orchestration platform such as public cloud compute instances, private cloud physical or virtual machines, hypervisor VMs, and on-premise physical hardware and is self-driven.
- Installs on Linux, CentOS, and Ubuntu platforms as a Python Plugin installation package and Docker containerization.
- Supports single or multiple Thunder instances.
- Supports Thunder instances running under AWS Auto Scaling Group or Azure Virtual Machine Scale Set (VMSS).
- Collects data from any type of Thunder device installed on public cloud compute instances, private cloud physical or virtual machines, hypervisor VMs, and on-premise physical hardware installation.
- Publishes data to Azure Cloud, AWS Cloud, VMware ESXi, Kibana (Elasticsearch), Grafana (Prometheus and Pushgateway), Splunk,GCP, and OCI.
Download Links
The following
Figure 1 : TOA Workflow
Supported Technology
The following table provides TOA-supported technologies:
| Name | Version | License |
|---|---|---|
|
Python |
3.10 |
PSF License |
|
Requests |
2.27.1 |
Apache Software License 2.0 |
|
Boto3 |
1.24.25 |
|
|
google-auth |
2.22.0 |
Apache Software License 2.0, |
| oci | 2.121.1 |
Apache Software License and |
Supported Thunder Metrics
The following table lists the TOA-supported Thunder metrics:
|
Metric |
Description |
|||
|---|---|---|---|---|
|
Average data CPU usage, in percentage, for all data CPU configured within a Thunder instance for the last data collection cycle. |
||||
|
Memory Usage Percentage |
Memory (RAM) usage, in percentage, of a Thunder instance for the last data collection cycle. |
|||
|
Disk Usage Percentage |
Average disk storage usage, in percentage, for all disks associated with a Thunder instance for the last data collection cycle. |
|||
|
Throughput Rate (Global/BPS) |
Total Thunder system global throughput bits per sec from Thunder instance to the server for the last data collection cycle. |
|||
|
Interface Down Count (Data) |
Count of the total data network interfaces configured for a Thunder instance which is inactive for the last data collection cycle. |
|||
|
Total New Connection (Sec) |
Count of the total new connections sent from Thunder instance to the server for the last data collection cycle per second. This includes L4-conns-per-sec, L7-conns-per-sec, L7-trans-per-sec, ssl-conns-per-sec, and ip-nat-conns-per-sec. |
|||
|
Transactions Rate (Sec) |
Count of the total L7 transactions made per second from Thunder instance to the server for the last data collection cycle. |
|||
|
Server Down Count |
Count of the total web or app servers configured in the Thunder instance that are not reachable from Thunder for the last data collection cycle. |
|||
|
Server Down Percentage |
Percentage of the total web or app servers configured in the Thunder instance that are not reachable from Thunder for the last data collection cycle. |
|||
|
SSL Errors Count |
Count of the total errors that occurred during data transmission from Thunder to the server due to SSL connection, negotiate, encrypt, and decrypt for the last data collection cycle. |
|||
|
Server Errors Count |
Count of the total errors that occurred during data transmission from Thunder to the server with status codes 4xx and 5xx for that last data collection cycle. |
|||
|
Total Session Count |
Count of the total active sessions of the Thunder instance for the last data collection cycle. |
|||
|
Packet Rate (Sec) |
Count of the total packets sent from or received at the Thunder instance for the last collection cycle.
|
|||
|
Packet Drop Rate (Sec) |
Count of the total packets dropped while sending data from or receiving data at the Thunder instance for the last collection cycle.
|
Supported Thunder Logs
The following table lists the TOA-supported Thunder logs:
|
Logs |
Description |
|---|---|
|
SysLogs |
Thunder internal logs such as:
|
Supported ACOS Versions
The following table provides the TOA-supported ACOS versions:
| ACOS Version | TOA Version | ADC | CGN | SSLi | TPS |
|---|---|---|---|---|---|
|
>=1.0.0 |
√ |
X |
X |
X |
|
|
>=1.0.0 |
√ |
X |
X |
X |
|
|
>=1.0.0 |
√ |
X |
X |
X |
|
|
>=1.0.0 |
√ |
X |
X |
X |
|
|
>= 1.0.0 |
√ |
X |
X |
X |
|
|
>= 1.0.0 |
√ |
X |
X |
X |
|
|
>= 1.0.0 |
√ |
X |
X |
X |
|
|
>= 1.0.0 |
√ |
X |
X |
X |
|
|
>= 1.0.0 |
√ |
X |
X |
X |
|
|
>= 1.0.0 |
√ |
X |
X |
X |
|
|
>= 1.0.0 |
√ |
X |
X |
X |
|
|
1.0.0 |
√ |
X |
X |
X |
Supported Platforms
The following table provides the TOA supported platforms and monitoring applications:
| Cloud Platform | Monitoring Applications |
|---|---|
|
AWS Cloud |
|
|
Azure Cloud |
|
|
VMware ESXi (On Premise) |
|
|
Elasticsearch |
|
|
Prometheus |
|
|
Splunk |
|
|
Google Cloud Platform (GCP) |
|
|
Oracle Cloud Infrastructure (OCI) |
|