Configure Autoscaling
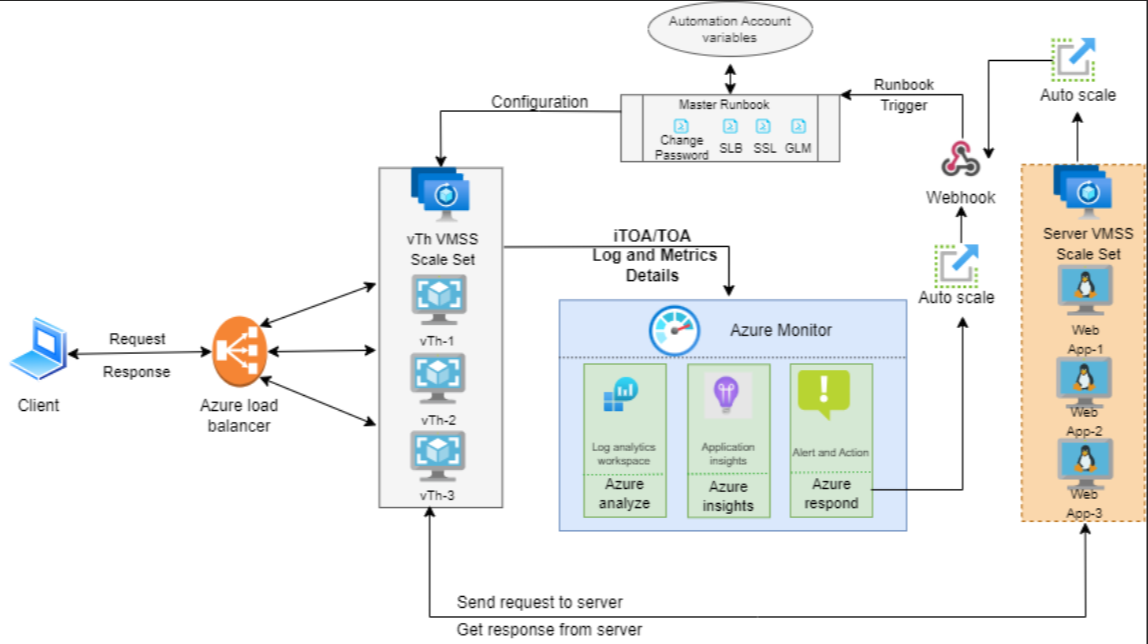
An Azure virtual machine scale set can automatically increase or decrease the number of vThunder VM instances to meet the changing demand. The Azure metrics and logs can be monitored using an internal Thunder Observability Agent (iTOA) or external Thunder Observability Agent (TOA).
Using iTOA or TOA:
- Custom metrics of vThunder can be collected and published into Azure Application Insights service and same metrics can be used along with VMSS rule for autoscaling. See Create Autoscale Rule.
- Alerts can be scheduled using VMSS alert rule. See Create Autoscale Alert.
- vThunder metrics can be viewed in the Azure Application Insights console.
- vThunder logs can be viewed in the Azure Log Analytics Workspace.
Figure 113 shows the process flow when different Azure resources and system components are connected to each other in the 3NIC-NVM-VMSS Autoscaling and Log Monitoring using iTOA or TOA.
To create autoscale rule, perform the following steps:
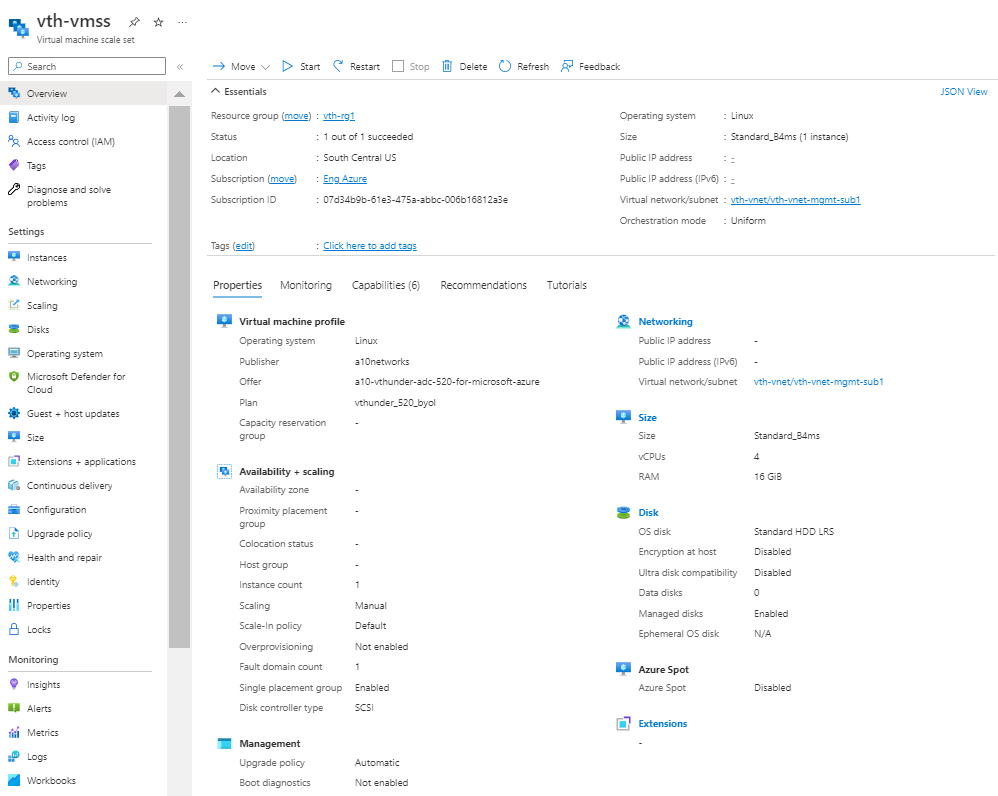
- From Home, navigate to Azure services > Virtual machine scale set ><vmss_name>.
The selected vmss - Overview window is displayed.Figure 114 : Selected VMSS - Overview window

- Click Scaling from the left Settings panel.
The selected vmss - Scaling window is displayed.Figure 115 : Selected VMSS - Scaling window

- Under Configure tab, select Custom autoscale option.
The fields relevant to this option are displayed. - Select the Scale mode as Scale based on a metric.
- Click Add a rule.
The Scale rule window is displayed.Figure 116 : Scale rule window

- Select or enter the information in the following fields:
- Metric source: Other resource
- Resource type: Application Insights
- Resource
- Time aggregation
- Metric namespace
- Metric name: <custom_metrics_name>
- Click Add to add the scale rule.
The selected vmss - Scaling window is displayed. - Click Save in the Configure tab to save the changes.
- Select Notify tab, enter the webhook url saved in the Create Automation Account Webhook step or you can get the url from Home > Azure services > Automation Accounts > <automation_account_name> > Shared Resources > Variables > azureAutoScaleResources > Value > masterWebhook_url.
Figure 117 : Selected VMSS - Scaling window - Notify tab


- From Home, navigate to Azure services > Virtual machine scale set ><vmss_name>.
The selected vmss - Overview window is displayed.Figure 118 : Selected VMSS - Overview window

- Click Alerts from the left Monitoring panel.
The selected vmss - Alerts window is displayed.Figure 119 : Selected VMSS - Alerts window

- Click Create > Alert rule.
The Create an alert rule - Scope window is displayed.Figure 120 : Create an alert rule window - Scope tab

- Click Select scope in the Scope tab.
The Select a resource window is displayed.Figure 121 : Select a resource window

- From Filter by resource type, select Application Insights.
The resource group having application insight resources are displayed. - Select the required application insight resource and click Done.
The selected application insight resource is listed under the alert rule scope. - Click Next : Condition at the bottom of the window.
The Create an alert rule - Condition tab window is displayed.Figure 122 : Create an alert rule window - Condition tab

- Click Add condition in the Condition tab.
The Select a signal window is displayed.Figure 123 : Select a signal window

- Select Custom log search as the signal.
The window to define the signal's logic is displayed in the alert rule condition. -
Enter any of the following query to fetch the data in the Search query field:
THUNDER_SYSLOGS_CL| where value > 85 | where timestamp > ago(30m)THUNDER_SYSLOGS_CL| where value > 85 | where timestamp > ago(24h)THUNDER_SYSLOGS_CL| where value > 85 | where timestamp > ago(7d)The above query specifies the frequency for alert data.
Figure 124 : Create an alert rule window - Condition tab

- Configure alert logic in the Alert logic section.
Figure 125 : Alert logic section

Depending on the signal logic configuration, the monthly cost for the alert is displayed.
- Click Next : Actions at the bottom of the window.
The Create an alert rule - Actions window is displayed.Figure 126 : Create an alert rule window - Actions tab

- Click Create action group.
The Create an action group - Basics window is displayed.Figure 127 : Create an action group window - Basics tab

- Select or enter the following mandatory information in the Basics tab:
Project details
- Subscription
- Resource group
- Region
Instance details
- Action group name
- Display name
- Click Next : Notifications at the bottom of the window.
The Create an action group - Notifications window is displayed. - Select the Notification type.
The corresponding window to configure the notification type is displayed.Figure 128 : Create an action group window - Notifications tab - Type

- Select the Email option and provide the correct email ID in the Email field and then click OK.
- Enter a unique name for the notification in the Name field.
Figure 129 : Create an action group window - Notifications tab

- Skip the other tabs and click Review + create at the bottom of the window.
The Create an action group - Review + create window is displayed.Figure 130 : Create an action group window - Review + create tab

- Click Create.
The action group is listed under Actions tab.Figure 131 : Create an alert rule window - Actions tab

- Select or enter the following mandatory information in the Basics tab:
- Select the recently created action group.
The selected action group is displayed.Figure 132 : Selected action group

- Click Test action group (preview).
The Test <action_group_name>-alert window is displayed.Figure 133 : Test <action_group_name>-alert window

- Select Billing alert as the Sample type and click Test.
The running status for the test rule is displayed.Figure 134 : Test <action_group_name>-alert window - Running status

When the success status is displayed, an email notification is triggered to the email ID provided in the Email Notification step.
Figure 135 : Email Notification

- Click Done on Test <action_group_name>-alert window.
The selected action group is displayed. - Close the selected action group window.
The Create an alert rule - Actions window is displayed. - Click Next : Details at the bottom of the window.
The Create an alert rule - Details window is displayed.Figure 136 : Create an alert rule window - Details tab

- Enter the Alert rule name and provide the other mandatory details.
- Skip the other tabs and click Review + create at the bottom of the window.
The Create an alert rule - Review + create window is displayed.Figure 137 : Create an alert rule window - Review + create tab

- Click Create.
The alert rule is created. - From Home, navigate to Azure services > Resource groups > <resource_group_name>.
The selected resource group - Overview window is displayed.Figure 138 : Selected resource group - Overview window

- Click Alerts from the left Monitoring panel.
The selected alert window is displayed. - Click Alert rules.
The alert rules for the selected resource group is displayed.Figure 139 : Selected resource group - Alert rules window


